In trade, the price of a management decision is especially high. A purchasing error leads to excess stock or shortages, a misjudgment of demand to lost sales, and a late reaction to declining margins goes straight to the bottom line.
Yet for most companies today, the problem is not a lack of information. On the contrary, there is more and more data. Sales are recorded in ERP and accounting systems, customer interaction history is kept in the CRM, stock levels in warehouse systems, and online orders in the web store and on marketplaces. Point-of-sale systems, loyalty programs, advertising platforms, and countless Excel files complete the picture.
As a result, the data exists, but getting a quick answer to a simple management question can be hard.
Why did profit in a particular category fall? Which product needs to be reordered urgently? Where has excess stock built up? Why do two regions with similar conditions show completely different sales trends?
To find the cause, employees have to compare several reports, verify figures, and consolidate information by hand.
That is why the value of data is no longer determined by its volume, but by the speed at which a business can turn it into a concrete decision.
Modern business intelligence solves this problem: it brings together information from different sources, creates a single view of the state of the business, and lets you move from the question “What happened?” to the more important one: “Why did it happen, and what should we do about it?”
From Reporting to Data-Driven Management
A traditional report usually shows results for a given period. For example: sales fell by 7%, margin decreased, and inventory grew.
For management, that is not enough.
A manager needs to understand which factors lie behind the change in the numbers. Sales could have fallen because popular items were out of stock, prices changed, traffic declined, a promotion ended, or the product mix shifted. Revenue growth does not always mean a better result either: margins may be falling at the same time, or the share of less profitable products may be rising.
A BI system makes it possible to explore these relationships directly in the data. The user can start with a company-wide metric, then drill down to a region, a store, a product category, an individual item, or a customer segment.
Instead of several static reports, there is a single analytical environment in which the causes of deviations can be investigated step by step.
Which Business Questions Analytics Helps Answer
In trading companies, BI can support virtually the entire decision-making cycle.
|
Business task |
What analytics provides |
|
Which products matter most for financial results? |
ABC/XYZ analysis helps assess each item’s contribution to sales and the stability of demand |
|
What caused the change in revenue? |
PVM analysis separates the effects of price, sales volume, and product mix |
|
Which customers are becoming less active? |
RFM segmentation helps identify customer groups that need attention |
|
Where do excess stock or shortages arise? |
Inventory analysis shows stock levels, turnover, and sell-through speed |
|
Which stores and regions perform better? |
KPI comparison lets you benchmark units and look for the reasons behind differences |
|
How is the performance of the existing retail network changing? |
LFL analysis allows a fair comparison of like-for-like stores |
The main advantage of this approach is the ability to analyze not an isolated figure, but the context behind its change.
Suppose a category’s revenue has declined. Looking only at the headline KPI, you might conclude that demand has fallen and cut purchasing. A detailed analysis may show a different picture: demand held steady, but several of the most sought-after SKUs were out of stock.
In that case, the right management action is completely different.
What a Manager Needs to See Every Day
In trade, information loses relevance quickly. A decision based on week-old data may no longer fit the current situation.
Demand shifts under the influence of seasonality, promotions, prices, competitor activity, product availability, customer behavior, and many other external factors. Management analytics should therefore provide an up-to-date view of the business without a long wait for the next report.
The following are especially important in the daily management routine:
- sales and gross profit;
- plan fulfillment;
- margin;
- number of orders and customers;
- average basket size;
- inventory levels;
- shortages and excess stock;
- inventory turnover;
- performance of stores, regions, and channels;
- effectiveness of marketing activities;
- customer base dynamics.
But a set of KPIs alone does not make management effective.
The task of analytics is to show the relationships between metrics.
For example, a decline in average basket size may be accompanied by growth in the number of transactions, meaning the overall result for the business is positive. A rise in inventory may be linked not to falling demand but to a change in deliveries. A drop in profit with stable revenue can point to a worsening sales mix or a rise in cost of goods.
A modern BI system must therefore let users not just monitor metrics, but quickly drill down into them and test hypotheses.
How Business Intelligence Works
In almost any trading company, data is spread across several information systems.
The ERP holds one part of the information, the CRM another, and the warehouse system a third. Financial data lives in accounting software, and some calculations are still done by employees in Excel.
This gives rise to problems the business knows well: different versions of the same metric, manual reconciliation of figures, lengthy report preparation, and dependence on individual specialists.
Business intelligence changes the very principle of working with information.
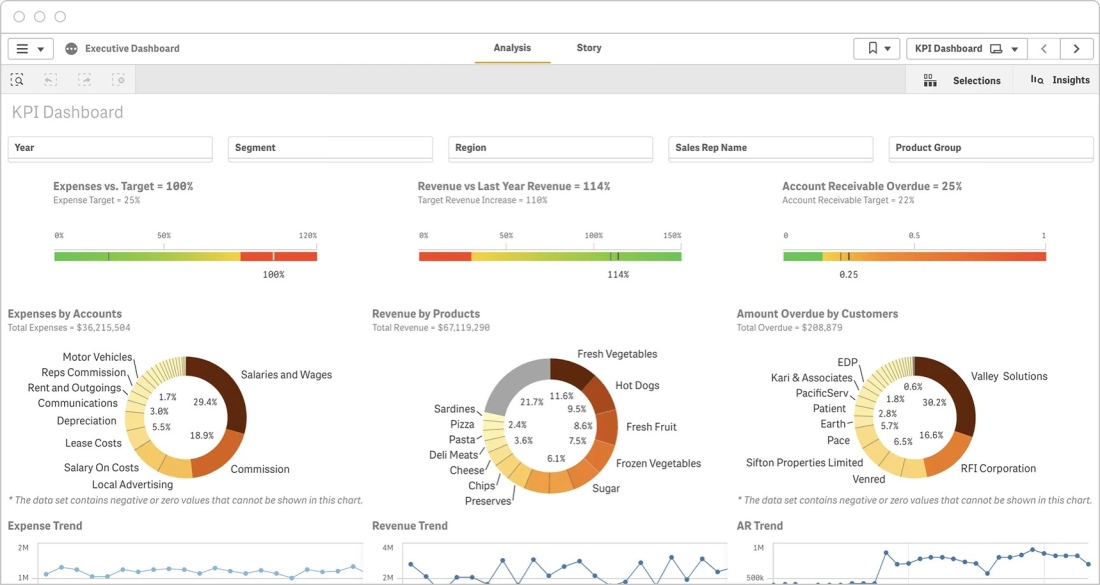
Data flows in automatically from corporate sources, goes through the necessary preparation stages, and is combined into a common analytical model. Metrics are calculated using agreed logic, after which users access them through interactive dashboards.
This creates a single information space, in which the commercial director, the store manager, the category manager, and top management all work with consistent data.
This significantly shortens the time between a change appearing in the business and the response to it.
Business Intelligence as Part of Daily Management
The main effect of BI is not yet another set of attractive reports.
The result appears when data becomes part of the daily decision-making process.
A manager sees a deviation and can immediately drill down to its causes. A category manager understands which items need attention. The purchasing department gets up-to-date information on inventory and demand. The commercial director sees sales and margin trends across the entire business.
At the same time, different departments rely on a single system of metrics instead of their own spreadsheets and versions of reporting.
For wholesale and retail, where the situation can change daily, the speed of getting an answer becomes an important efficiency factor. The less time passes between a change in a metric, an understanding of its cause, and a management action, the faster a company can respond to risks and seize new opportunities.
That is why modern business intelligence is no longer just a reporting tool. It is the infrastructure for data-driven management of the business.
If a company plans to develop BI or replace scattered reports with a single analytical system, it makes sense to start not with the number of future dashboards, but with specific management questions: which decisions need to be made faster, what data is missing today, and how much time the business spends looking for an answer.
These are the questions where analytics that truly brings practical benefit begins.